 Slide 4-2

 Slide 4-2
Because this module depends upon a graphical technique rather than the results from a series of experimental manipulations, our presentation develops depiction issues. The first is the interpretation or meaning of changes in Cartesian space used in the analysis.
 Slide 4-3
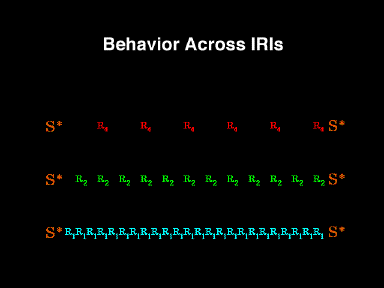
If responding were as regular as a metronome across the entire interreinforcer interval, we could depict a response every 4 seconds or every 2 seconds or every second in this way. The time between the reinforcers is filled with evenly spaced responses separated by 4, 2, or 1 second, respectively.
 Slide 4-4
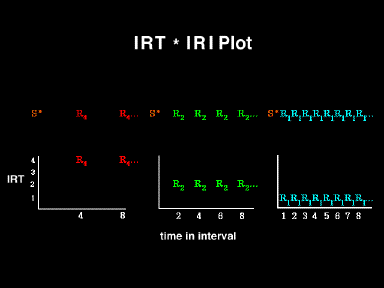
If we wanted to increase our ability to detect any small difference between those apparently evenly spaced responses, we could line them up, so to speak, to see if one were taller or shorter than all the rest. Additionally, if we wished to see if there were any systematic changes across the IRI, we could plot each interresponse time as a function of time in the interval. This technique would maximize our ability to see systematic changes in IRT durations across the IRI. In the examples, we had defined the IRTs as identical, so we would not see differences; rather, we would see that the IRTs were constant across the entire IRI.
 Slide 4-5
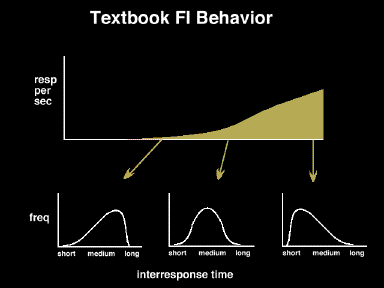
Often however, schedules generate rate changes across the IRI. A fixed-interval schedule is an obvious example.
By looking at the changes in the local rates, we can infer that pecks are slower or more widely spaced early in the interval and faster or more closely spaced late in the interval.
 Slide 4-6
This slide depicts the successively shorter interresponse times which would produce that increase in local rate across the IRI.
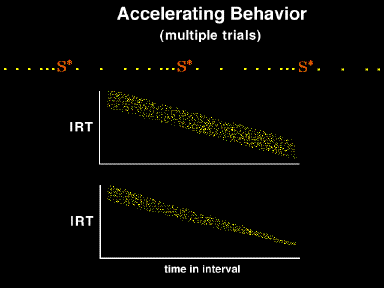 Slide 4-7
This slide illustrates the interresponse times from multiple trials plotted as dots on the same axes. Each frame represents the interresponse time across many interreinforcement intervals. Both frames show a linear decrease in the interresponse time durations as the interval elapses. The top one shows no change in the variance (i.e., absolute variance irrespective of interresponse time). The second frame shows a decrease in variance (e.g., variance decreases as a function of interresponse time).